Wired Watchdog of the Waterways
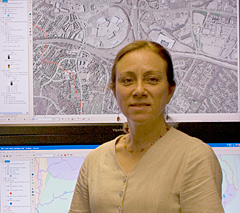
Claire Welty watched a thunderstorm roll in from the west. The network of monitors tracking Gwynns Falls streams began to react, tracking the Baltimore area’s streams and rivers like an MRI of a patient’s veins and arteries.
Welty, director of the Center for Urban Environmental Research and Education (CUERE), was able to see this big-picture view of the Chesapeake Bay Watershed without even donning her field’s traditional waders or even feeling a drop of rain, thanks to CUERE’s new Computational and Visualization Lab. The high-tech facility located in the Technology Research Center offers near real-time views and a wealth of environmental and water science data on a bank of large screen TV monitors.
On the surface, the Lab looks like a cousin of a financial analyst’s war room or a big city’s traffic nerve center. On one screen, a Google Earth animation mash up produced by UMBC environmental science major Daniel Jones flies viewers around the area. The animation stops briefly at each of the multitude of gauges and sensors found across the region’s waterways. Thanks to the work of scientists affiliated with CUERE, the Baltimore Ecosystem Study, and the U.S. Geological Survey, greater Baltimore is one of the most heavily monitored urban watersheds in the country.
Other screens show visual data from weather radar, web cameras monitoring smog, aircraft flyovers, satellite instruments and other sophisticated tools of the modern water scientist’s trade. One animation, made by UMBC/GES graduate student and IGERT Fellow Garth Lindner, models the ebb and flow of water through a road culvert.
Welty’s vision for the Lab was brought to life thanks to the work of CUERE staff Jeffrey Campbell and Michael McGuire, who helped bring Welty’s vision of a real-time hydrologic monitoring nerve center to life.
“We’re so excited to have this powerful research and teaching tool,” said Welty. “The Visualization Lab will help us predict, model and track the flow of many factors that impact the health of our waterways and the Chesapeake Bay. It also gives us a dynamic, eye-catching way to demonstrate to the public and partners how our research directly affects Marylanders.”
(8/28/09)