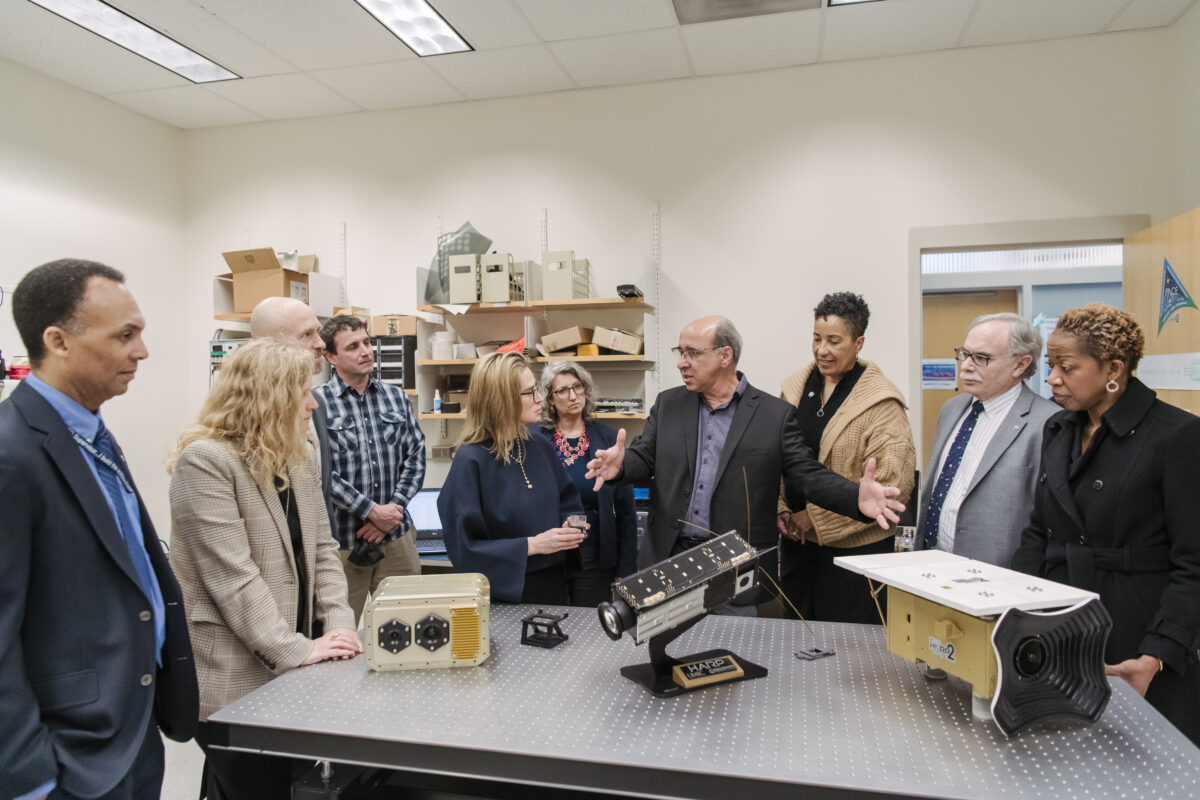
UMBC hosts “NASA Days” event series with Goddard Space Flight Center Sep 13, 2024 / 4 minutes of reading
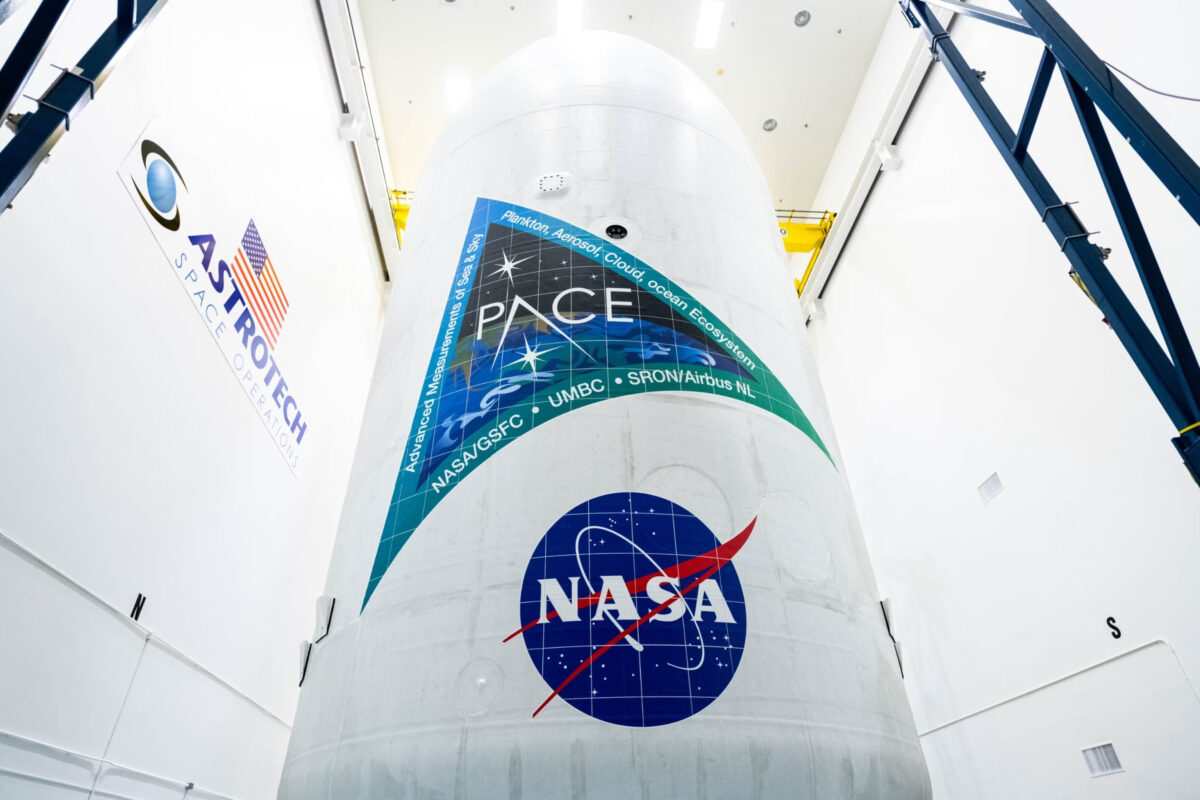
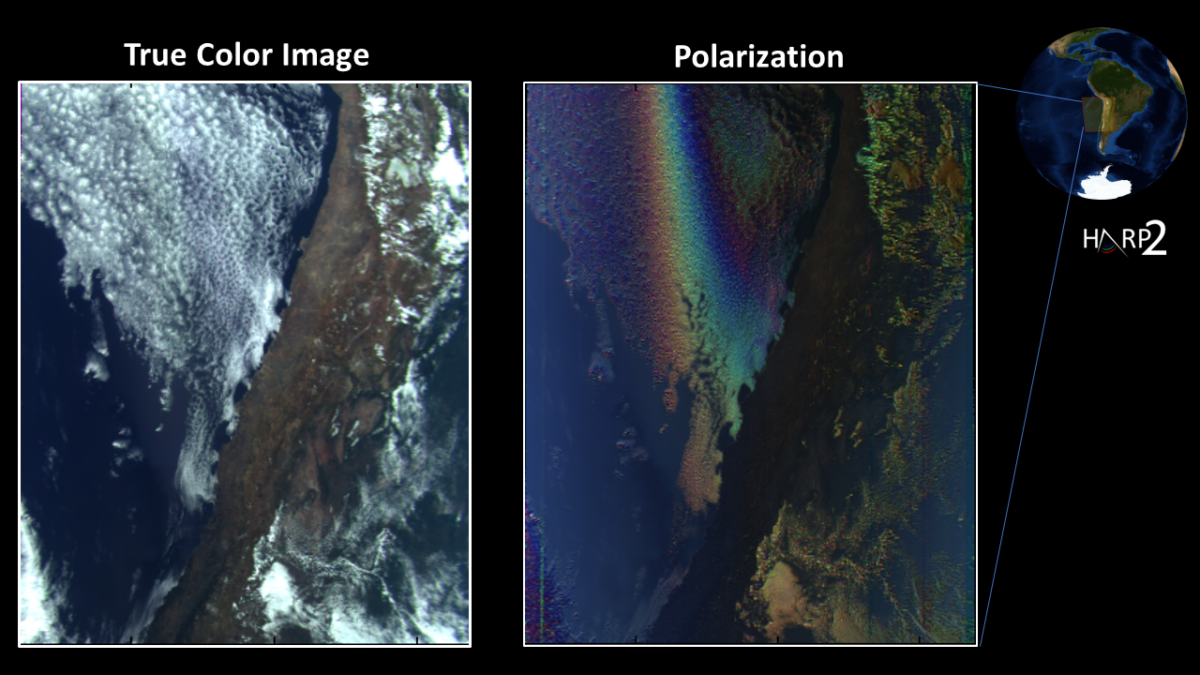
First data from UMBC’s HARP2 instrument on NASA PACE mission goes public Apr 11, 2024 / 5 minutes of reading